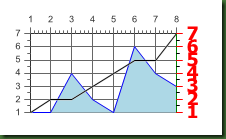
dojo Charts: addSeries()

<html >
<meta http-equiv=”Content-Type” content=”text/html; charset=utf-8″>
<title>Untitled 1</title>
<script type=”text/javascript” src= “../js/dojo/dojo/dojo.js” djConfig=”isDebug: true”></script>
<script type=”text/javascript”>
dojo.require(“dojox.charting.Chart2D”);
makeCharts = function(){
var chart1 = new dojox.charting.Chart2D(“simplechart”);
chart1.addPlot(“default”, {type: “Lines”});
chart1.addPlot(“other”, {type: “Areas”, hAxis: “other x”, vAxis: “other y”});
chart1.addPlot(“Grid”, {type: “Grid”, hAxis: “other x”,    vAxis: “other y”,hMajorLines: true,    hMinorLines: false,    vMajorLines: true,    vMinorLines: false});
chart1.addAxis(“x”, {
    labels: [{value: 1, text: “Jan”}, {value: 2, text: “Feb”},
        {value: 3, text: “Mar”}, {value: 4, text: “Apr”},
        {value: 5, text: “May”}, {value: 6, text: “Jun”},
        {value: 7, text: “Jul”}, {value: 8, text: “Aug”},
        {value: 9, text: “Sep”}, {value: 10, text: “Oct”},
        {value: 11, text: “Nov”}, {value: 12, text: “Dec”}]
    });
chart1.addAxis(“y”, {vertical: true});
chart1.addAxis(“other x”, {leftBottom: false});
chart1.addAxis(“other y”, {vertical: true,
    leftBottom: false,
    max: 7,
    stroke: “green”,
    font: “normal normal bold 14pt Tahoma”,
    fontColor: “red”,
    majorTick: {color: “red”, length: 6},
    minorTick: {stroke: “black”, length: 3}
});
chart1.addSeries(“Series 1”, [1, 2, 4, 5, 5, 7], {stroke: {color: “blue”, width: 2},
    fill: “lightblue”});
    chart1.addSeries(“Series 2”, [1, 1, 4, 2, 1, 6, 4, 3],
        {plot: “other”, stroke: {color:”blue”}, fill: “lightblue”}
);

chart1.render();

};
dojo.addOnLoad(makeCharts);
</script>
</head>
<body>
<div id=”simplechart” style=”width: 250px; height: 150px;”></div>
</body>
</html>

Output:

image

dojo Charts: Add Grids

<html >

<meta http-equiv=”Content-Type” content=”text/html; charset=utf-8″>
<title>Untitled 1</title>
<script type=”text/javascript” src= “../js/dojo/dojo/dojo.js” djConfig=”isDebug: true”></script>
<script type=”text/javascript”>
dojo.require(“dojox.charting.Chart2D”);
makeCharts = function(){
var chart1 = new dojox.charting.Chart2D(“simplechart”);
chart1.addPlot(“default”, {type: “Lines”});
chart1.addPlot(“other”, {type: “Areas”, hAxis: “other x”, vAxis: “other y”});
chart1.addPlot(“Grid”, {type: “Grid”, hAxis: “other x”,    vAxis: “other y”,hMajorLines: true,    hMinorLines: false,    vMajorLines: true,    vMinorLines: false});
chart1.addAxis(“y”, {vertical: true});
chart1.addAxis(“other x”, {leftBottom: false});
chart1.addAxis(“other y”, {vertical: true,
    leftBottom: false,
    max: 7,
    stroke: “green”,
    font: “normal normal bold 14pt Tahoma”,
    fontColor: “red”,
    majorTick: {color: “red”, length: 6},
    minorTick: {stroke: “black”, length: 3}
});
chart1.addSeries(“Series 1”, [1, 2, 2, 3, 4, 5, 5, 7]);
chart1.addSeries(“Series 2”, [1, 1, 4, 2, 1, 6, 4, 3],
        {plot: “other”, stroke: {color:”blue”}, fill: “lightblue”}
);
chart1.render();

};
dojo.addOnLoad(makeCharts);
</script>
</head>
<body>
<div id=”simplechart” style=”width: 250px; height: 150px;”></div>
</body>
</html>

Output:

image

dojo Charts: Coloring Axis

<html>

<head runat=”server”>
<meta http-equiv=”Content-Type” content=”text/html; charset=utf-8″>
<title>Untitled 1</title>
<script type=”text/javascript” src= “../js/dojo/dojo/dojo.js” djConfig=”isDebug: true”></script>
<script type=”text/javascript”>
dojo.require(“dojox.charting.Chart2D”);
makeCharts = function(){
var chart1 = new dojox.charting.Chart2D(“simplechart”);
chart1.addPlot(“default”, {type: “Lines”});
chart1.addPlot(“other”, {type: “Areas”, hAxis: “other x”, vAxis: “other y”});
chart1.addAxis(“x”);
chart1.addAxis(“y”, {vertical: true});
chart1.addAxis(“other x”, {leftBottom: false});
chart1.addAxis(“other y”, {vertical: true,
    leftBottom: false,
    max: 7,
    stroke: “green”,
    font: “normal normal bold 14pt Tahoma”,
    fontColor: “red”,
    majorTick: {color: “red”, length: 6},
    minorTick: {stroke: “black”, length: 3}
});
chart1.addSeries(“Series 1”, [1, 2, 2, 3, 4, 5, 5, 7]);
chart1.addSeries(“Series 2”, [1, 1, 4, 2, 1, 6, 4, 3],
        {plot: “other”, stroke: {color:”blue”}, fill: “lightblue”}
);
chart1.render();

};
dojo.addOnLoad(makeCharts);
</script>
</head>
<body>
<div id=”simplechart” style=”width: 250px; height: 150px;”></div>
</body>
</html>

Output:

image

dojo Charts: addAxis()

<html>

<head runat=”server”>
<meta http-equiv=”Content-Type” content=”text/html; charset=utf-8″>
<title>Untitled 1</title>
<script type=”text/javascript” src= “../js/dojo/dojo/dojo.js” djConfig=”isDebug: true”></script>
<script type=”text/javascript”>
dojo.require(“dojox.charting.Chart2D”);
makeCharts = function(){
var chart1 = new dojox.charting.Chart2D(“simplechart”);
chart1.addPlot(“default”, {type: “Lines”});
chart1.addPlot(“other”, {type: “Areas”, hAxis: “other x”, vAxis: “other y”});
chart1.addAxis(“x”);
chart1.addAxis(“y”, {vertical: true});
chart1.addAxis(“other x”, {leftBottom: false});
chart1.addAxis(“other y”, {vertical: true, leftBottom: false});
chart1.addSeries(“Series 1”, [1, 2, 2, 3, 4, 5, 5, 7]);
chart1.addSeries(“Series 2”, [1, 1, 4, 2, 1, 6, 4, 3],
        {plot: “other”, stroke: {color:”blue”}, fill: “lightblue”}
);
chart1.render();

};
dojo.addOnLoad(makeCharts);
</script>
</head>
<body>
<div id=”simplechart” style=”width: 250px; height: 150px;”></div>
</body>
</html>

Output:

image

dojo Charts: Multiple Plots

<html>

<head runat=”server”>
<meta http-equiv=”Content-Type” content=”text/html; charset=utf-8″>
<title>Untitled 1</title>
<script type=”text/javascript” src= “../js/dojo/dojo/dojo.js” djConfig=”isDebug: true”></script>
<script type=”text/javascript”>
dojo.require(“dojox.charting.Chart2D”);
makeCharts = function(){
    var chart1 = new dojox.charting.Chart2D(“simplechart”);
chart1.addPlot(“default”, {type: “Lines”});
chart1.addPlot(“other”, {type: “Areas”});
chart1.addAxis(“x”);
chart1.addAxis(“y”, {vertical: true});
chart1.addSeries(“Series 1”, [1, 2, 2, 3, 4, 5, 5, 7]);
chart1.addSeries(“Series 2”, [1, 1, 4, 2, 1, 6, 4, 3], {plot: “other”, stroke: {color:”blue”}, fill: “lightblue”});
chart1.render();
};
dojo.addOnLoad(makeCharts);
</script>
</head>
<body>
<div id=”simplechart” style=”width: 250px; height: 150px;”></div>
</body>
</html>

Output:

image

dojo Charts: Advanced Line Chart

<html>

<head runat=”server”>
<meta http-equiv=”Content-Type” content=”text/html; charset=utf-8″>
<title>Untitled 1</title>
<script type=”text/javascript” src= “../js/dojo/dojo/dojo.js” djConfig=”isDebug: true”></script>
<script type=”text/javascript”>
dojo.require(“dojox.charting.Chart2D”);
makeCharts = function(){
    var chart1 = new dojox.charting.Chart2D(“simplechart”);
    chart1.addPlot(“default”, {type: “Lines”, markers: true, tension:3, shadows: {dx: 2, dy: 2, dw: 2}});
    chart1.addAxis(“x”);
    chart1.addAxis(“y”, {vertical: true});
    chart1.addSeries(“Series 1”, [1, 2, 2, 3, 4, 5, 5, 7]);
    chart1.render();
};
dojo.addOnLoad(makeCharts);
</script>
</head>
<body>
<div id=”simplechart” style=”width: 250px; height: 150px;”></div>
</body>
</html>

Output:

image

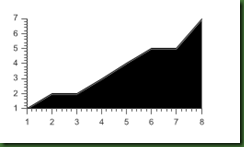
dojo Charts: Area Chart

<html>

<head runat=”server”>
<meta http-equiv=”Content-Type” content=”text/html; charset=utf-8″>
<title>Untitled 1</title>
<script type=”text/javascript” src= “../js/dojo/dojo/dojo.js” djConfig=”isDebug: true”></script>
<script type=”text/javascript”>
dojo.require(“dojox.charting.Chart2D”);
makeCharts = function(){
    var chart1 = new dojox.charting.Chart2D(“simplechart”);
    chart1.addPlot(“default”, {type: “Areas”});
    chart1.addAxis(“x”);
    chart1.addAxis(“y”, {vertical: true});
    chart1.addSeries(“Series 1”, [1, 2, 2, 3, 4, 5, 5, 7]);
    chart1.render();
};
dojo.addOnLoad(makeCharts);
</script>
</head>
<body>
<div id=”simplechart” style=”width: 250px; height: 150px;”></div>
</body>
</html>

output:

image

dojo Charts: Line Chart


<html>

<head runat=”server”>
<meta http-equiv=”Content-Type” content=”text/html; charset=utf-8″>
<title>Untitled 1</title>
<script type=”text/javascript” src= “../js/dojo/dojo/dojo.js” djConfig=”isDebug: true”></script>
<script type=”text/javascript”>
dojo.require(“dojox.charting.Chart2D”);
makeCharts = function(){
    var chart1 = new dojox.charting.Chart2D(“simplechart”);
    chart1.addPlot(“default”, {type: “Lines”});
    chart1.addAxis(“x”);
    chart1.addAxis(“y”, {vertical: true});
    chart1.addSeries(“Series 1”, [1, 2, 2, 3, 4, 5, 5, 7]);
    chart1.render();
};
dojo.addOnLoad(makeCharts);
</script>
</head>
<body>
<div id=”simplechart” style=”width: 250px; height: 150px;”></div>
</body>
</html>


Output:


image